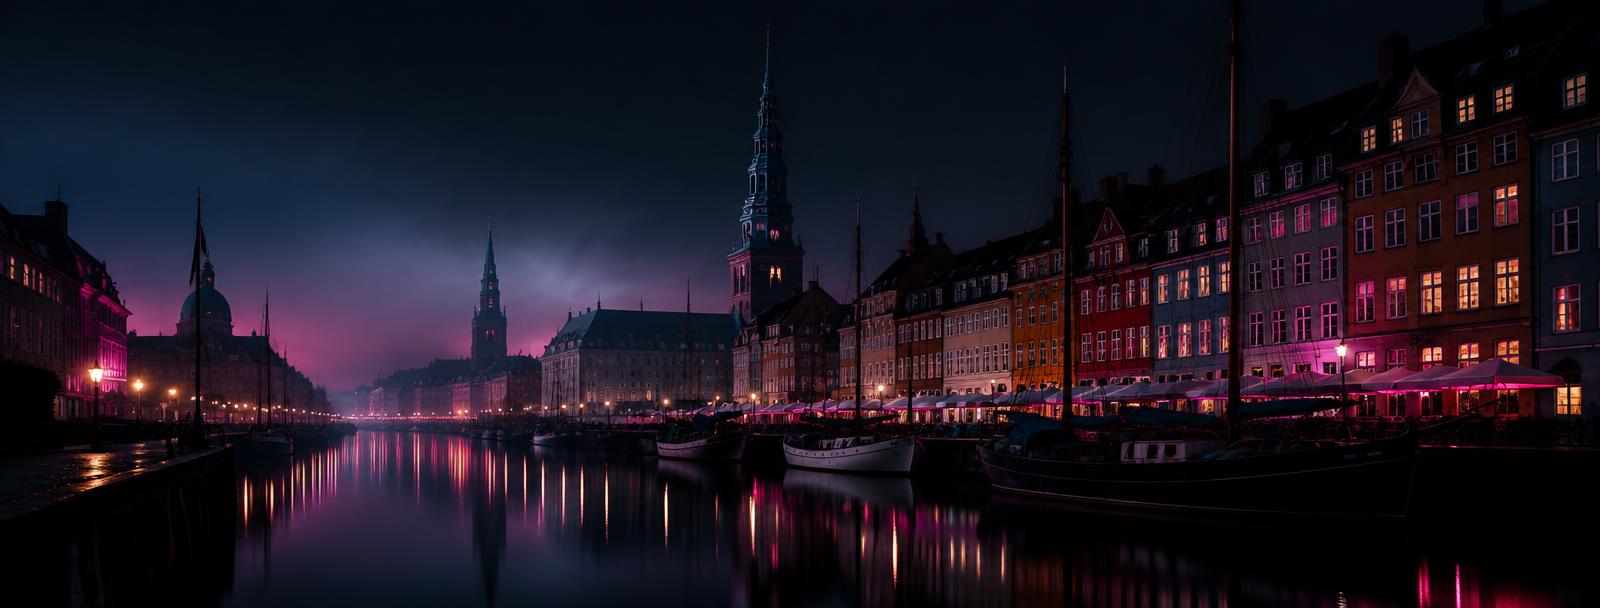
Nordics · DK
Copenhagen
City reading
Copenhagen
Health is Copenhagen's clearest specialisation: 1.8 times the European rate across 29 companies.
As early-stage VCs, most companies we look at are early, some pre-inception. To properly capture the formation layer, we looked back no more than 18 months from a company's founding, and no more than one institutional round raised.
We believe getting to the core truth of a company radiates from the founding team, and that those signs show up long before a company has its breakout success. So we got on the ground, city by city, talking directly to the ecosystem leaders, university professors, angels, operators and micro VCs who see these companies before anyone else does. The names that kept coming up independently, before they showed up anywhere public, were what we went after.
Every one of those names, alongside thousands of other companies we track a year, went through the same internal scoring model: the scale of impact the company could have globally, how genuinely AI-native the product is, the strength of the thesis, and the team, their talent density, where they've built before, how deep that experience really runs. We ended up with ten companies per city that we believe combine all of the above, while capturing the city's own heartbeat and the themes defining it.
Formations counted
184
Every city in the sample on a log scale, 10 to 1,876 formations. Copenhagen is marked in pink. London sits at the far right as a volume outlier (1,876).
- Rank by formation volume
- 7 of 89
- SHARE OF SAMPLE EUROPEAN FORMATION
- 3.4%
- # FORMATIONS VERSUS THE AVERAGE CITY
- 2.99x
Category mix
What Copenhagen is made of
The categories these 184 companies fall into. AI-first software is the largest.
- AI-first software27%
- Conventional SaaS20%
- Health16%
- Consumer10%
- Infra9%
Specialisation
What Copenhagen builds
On raw volume most European cities look alike. Character only appears once each theme is compared with a typical European city. Every company now carries a category and sub-theme. Pink marks the categories where Copenhagen differs most; provisional comparisons rest on fewer than 10 companies and are never the lead claim.
Above the line means this city forms more of something than a typical European city does. Below means less.
- Centre line: a typical European city (1.0)
- Forms more than average
- Forms less than average
- Provisional: fewer than 10 companies
- Values read as 1.93x the average, then the theme's share of the city's companies
Typical European city (1.0)
Health1.76x the average · 15.8% of the city+ 3 sub-themes
- Clinics, practices & patient care48.3%
- Biotech tools & lab automation20.7%
- Drug discovery & therapeutics20.7%
AI-first software1.23x the average · 27.2% of the city+ 3 sub-themes
- AI tools for everyday work38.0%
- Marketing, ads & content12.0%
- HR, recruiting & talent8.0%
Infra1.19x the average · 8.7% of the city+ 2 sub-themes
- Cloud, compute & data infra56.3%
- Developer tooling & APIs37.5%